This post is the sixth in our series about myFutureNC’s Bite-Sized Webinars. Previous posts covered Family-Sustaining Wages, Labor Market Alignment, FAFSA and Financial Aid, NC Pre-K, and Opportunities for Growth.
North Carolina's Opportunity Youth: Where Are They? How Do We Reach Them?
Opportunity Youth were the focus of the sixth Bite-Sized Webinar from myFutureNC. This webinar explains how to authentically engage Opportunity Youth as leaders; and what programming and resources are currently available to individuals, parents/guardians, and organizations that work with Opportunity Youth. In this post we will be summarizing the webinar and also exploring the data for Opportunity Youth using the attainment profile for the Land of Sky region, which includes the counties of Buncombe, Henderson, Madison, and Transylvania.
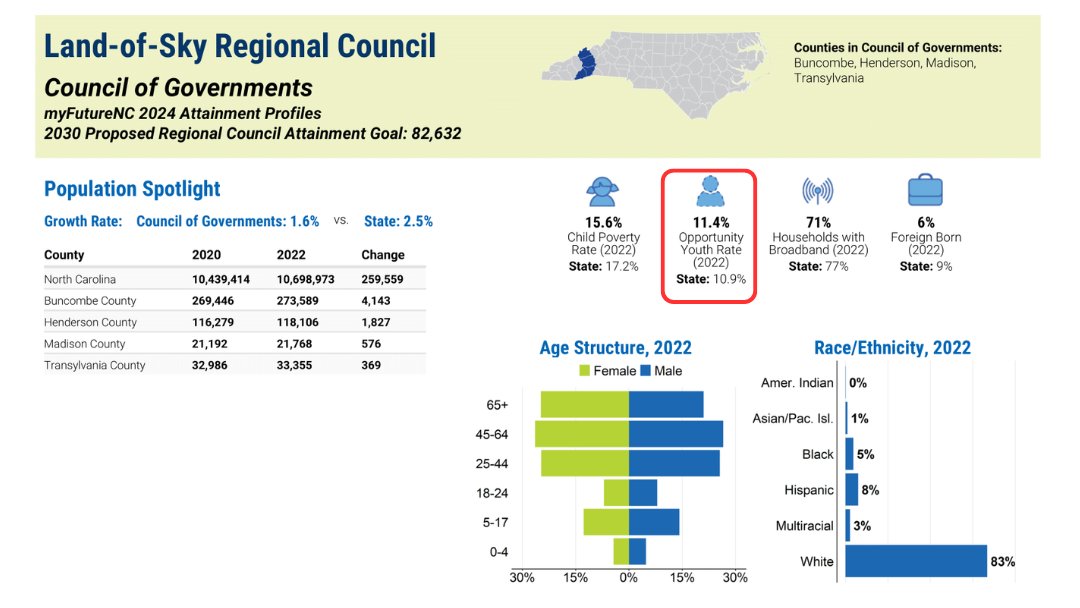
On May 7, 2024, Senemeht Olatunji, myFutureNC’s Regional Impact Manager for the Southwest Region, facilitated this Bite-Sized Webinar. Ms. Olatunji pointed out the Opportunity Youth statistic at the top of the first page of the attainment profile. For the state of NC, currently 10.9% of youth ages 16-24 are considered Opportunity Youth (i.e., they are not working and are not in school). That equates to 1 out of every 9 youth in North Carolina, or 141,823 individuals. Among NC’s 100 counties, the rate of Opportunity Youth ranges from 5% to 25%. myFutureNC’s 2030 goal for Opportunity Youth is 9%.
According to the attainment profile for the Land of Sky region (shown below with the Opportunity Youth rate outlined in red), 11.4% of young people ages 16-24 met the criteria for Opportunity Youth, meaning that they were not in school and not working.

Our State, Our Work
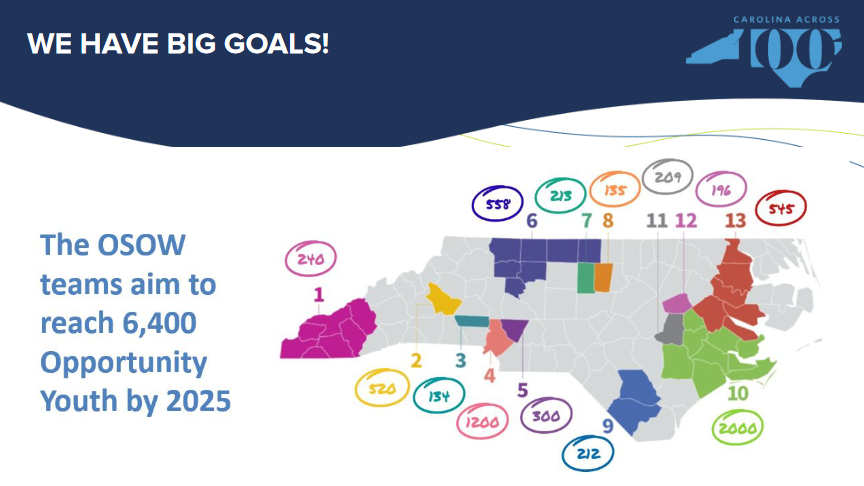
Anita Brown-Graham, Founder and Director of ncIMPACT, spoke about the Our State, Our Work initiative. This project works with local collaboratives across the state (shown in the map in the slide below) to re-engage Opportunity Youth by connecting them with employment or reconnecting them with education, with a goal of reaching 6,400 such youth by the end of 2024. In the project’s first 18 months, the community collaboratives and network of more than 300 partners across the state have provided 3,700 employment services and 2,300 educational services to Opportunity Youth. These teams also provided 4,600 employment services and 2,300 educational services to additional youth who are not currently Opportunity Youth but are at high risk for falling into that category. Ms. Brown-Graham emphasized the complex needs of Opportunity Youth require connections with multiple supports and services:
If you hear nothing else from my presentation, please understand that these are young people for whom the light touch isn’t going to be successful. They have to be touched frequently. They have to be touched through various programs in order for us to be successful.

Best Practices for Working with Opportunity Youth
The best practices section of this webinar featured Sarah Crisp, the Program Director for Work in Burke at the Industrial Commons. Work in Burke is one of the Our State, Our Work teams. Ms. Crisp shared some data about Burke County’s educational attainment and then gave an overview of two of Work in Burke’s initiatives: OPT-IN and JET. OPT-IN, or Opportunity Internship, is an 8-week paid internship available to students in the summer after high school graduation. The program model combines professional development with work experience and a community mentor with an end goal for participants to enroll in school, obtain permanent employment, or enroll in JET.
JET stands for Jobs, Education, and Training. This initiative serves Opportunity Youth ages 18-24 and helps place them in jobs or connect them with educational pathways. Like OPT-IN, the JET model also includes both mentorship and professional development. Both programs also focus on connecting participants with quality jobs that provide livable wages and benefits.
How does Work in Burke reach Opportunity Youth for its JET program? Ms. Crisp explained that they do a lot of recruiting on social media and other online spaces, go to every community event to get the word out, and also place marketing materials in places where young people tend to hang out.

Opportunity Youth Trends by County
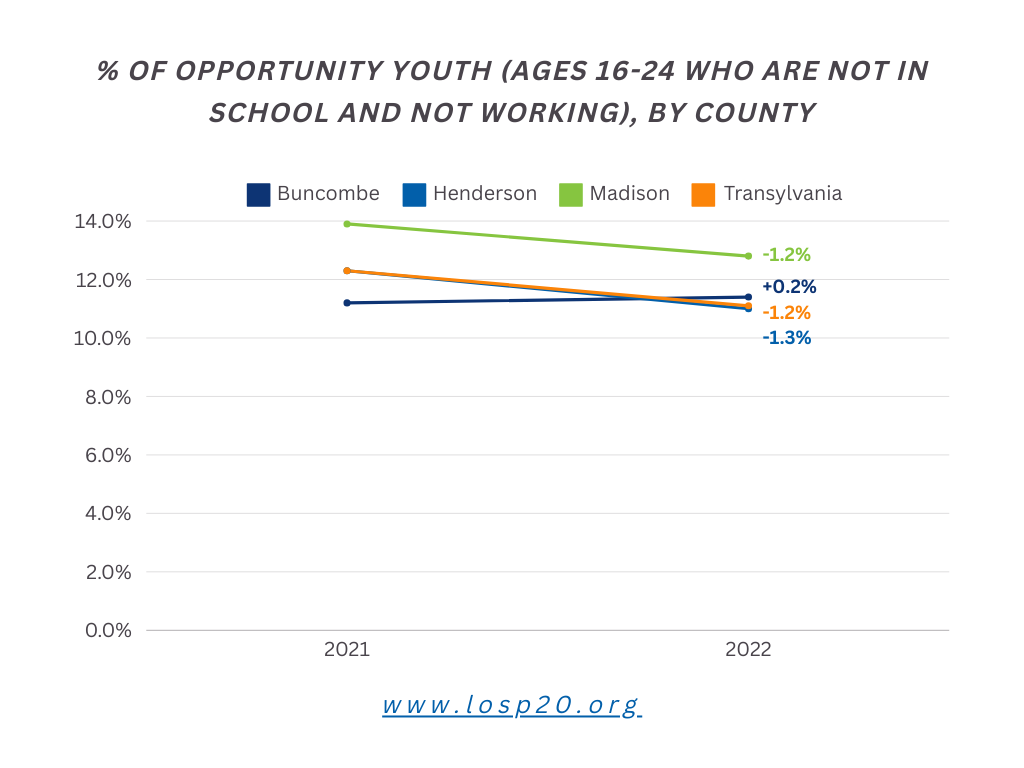
The chart below shows trends in the percentage of Opportunity Youth for each of our four counties 2021 and 2022, using both the February release and the April update of the 2024 attainment profiles from myFutureNC. Buncombe County data includes both Asheville City Schools and Buncombe County Schools. Henderson, Madison, and Transylvania have all decreased their rates of Opportunity Youth, whereas Buncombe has seen an increase in its percentage of Opportunity Youth.

Connection to Our 2030 Goals for Educational & Workforce Attainment
The Opportunity Youth indicator connects to three of our four strategic goals:
- Increase high-school graduation rate to 95%
- Improve post-secondary enrollment success to 65%
- Ensure that 90% of adults ages 25-44 in the labor force obtain credentials that align with employers’ needed competencies
Re-engaging Opportunity Youth is crucial for achieving our overall educational attainment goal for 2030 of 82,000 workers with the credentials and skills to fill workforce demands in our four-county region. Carolina Demography projected we would be 10,000 workers short of that attainment goal. The 72,000 students and workers who are already on the trajectory to have those needed credentials that are aligned with employers’ needs are not the primary focus of our work. Rather, bridging the gap requires us to reach out to students and workers who are not already on the pathway to obtain one of those needed credentials. That means we need to develop initiatives to reach individuals who have experienced barriers in their education and/or work experience, and that includes Opportunity Youth.
While we do not currently have any initiatives specifically for Opportunity Youth, you can learn more about some of our initiatives that address this population indirectly in other posts in this series that cover FAFSA and financial aid, labor market alignment, and family-sustaining wages.
Visit myFutureNC’s Opportunity Youth indicator page for more information including comparison data from other states, an explanation for why this indicator matters, data on the state’s long-term performance (both in the aggregate and disaggregated by sex and race/ethnicity), details on the methodology, and links to other organizations in NC that are working on this topic.
Stay tuned for more in this series. Next up: Career and College Promise (CCP).


