This post is the third in our series about myFutureNC’s Bite-Sized Webinars. In the first two posts, we covered Family-Sustaining Wages and Labor Market Alignment.
Let’s Make Sure the Class of 2024 Doesn’t Miss Out on Funding – FAFSA & Financial Aid Resources
FAFSA completion rates and postsecondary enrollment rates are the topics for this third post in our series on myFutureNC’s Bite-Sized Webinars. We will be exploring the data for the Land of Sky region as a whole and also individually for our four counties (Buncombe, Henderson, Madison, and Transylvania).
Toni Blount, myFutureNC’s Regional Impact Manager for the Southeast Region, led this Bite-Sized Webinar on April 16, 2024. Ms. Blount directed viewers’ attention to the College & Career Access section on page 2 of the statewide attainment profile for NC, which included the following statistic that pertained to financial aid: 62% of high school seniors in North Carolina completed the FAFSA in 2023. She also pointed out the related data points in this section, which include postsecondary enrollment intentions and actual postsecondary enrollment rates.
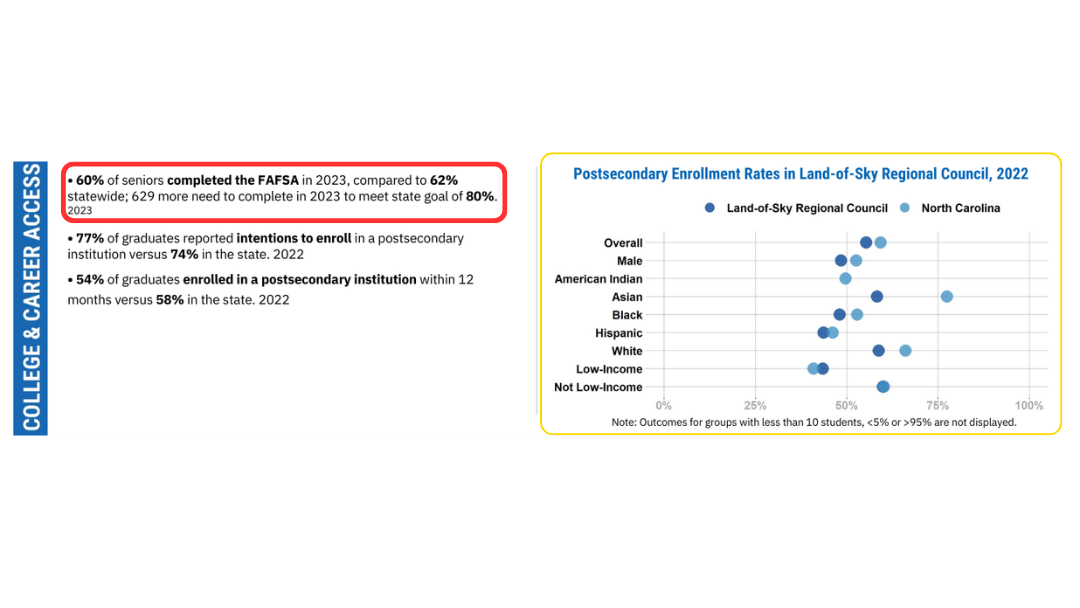
According to the 2024 regional profile for the Land of Sky, our FAFSA completion rate in 2023 was 60% (outlined in red in the image below). Another related data point on myFutureNC’s data profiles is the chart of Postsecondary Enrollment Rates (outlined in gold in the image below), which depicts enrollment rates for select demographic groups for both our region and the state.
Connection to Our 2030 Goals for Educational & Workforce Attainment
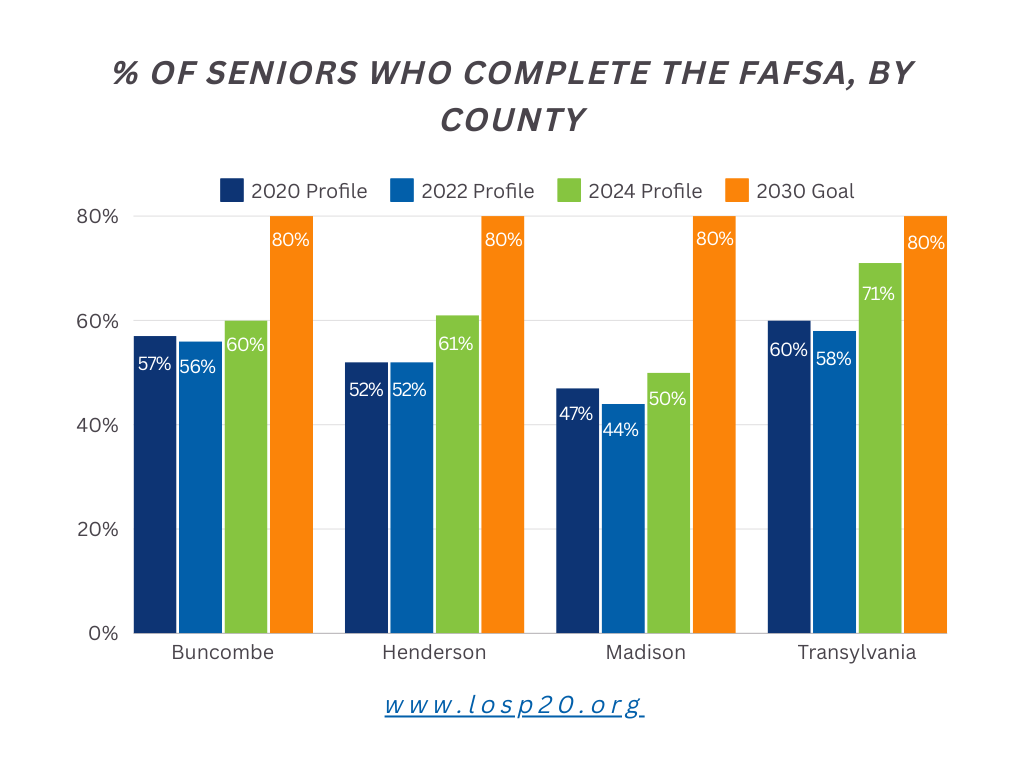
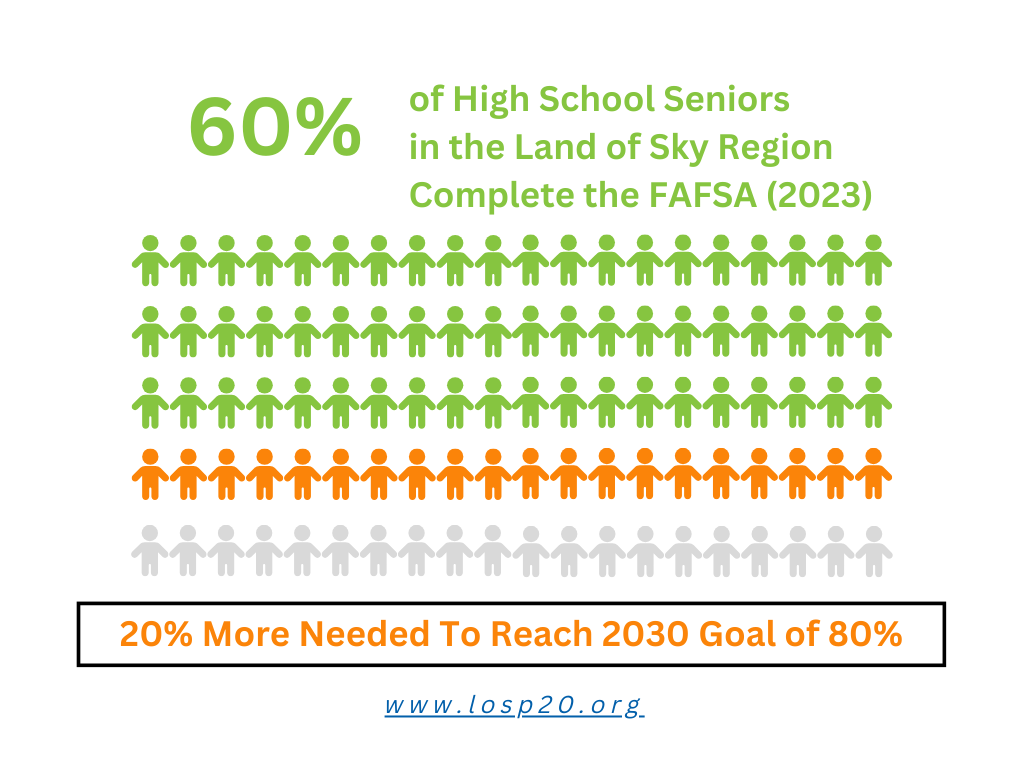
myFutureNC’s 2030 goal for FAFSA completion for the State of North Carolina is 80%, and we have the same 80% goal for the Land of Sky region. Since our FAFSA completion rate was 60% in 2023, that means we are 20% below our 2030 goal of 80%. The charts below show the FAFSA completion rates for each of our four counties according to the myFutureNC county profiles from 2020, 2022, and 2024 and compare them to our 2030 goal of 80%. Check out our data dashboard for dozens more charts like these that track our progress toward our educational and workforce attainment goals.
Postsecondary Success
Our FAFSA completion goal is just one of several metrics that falls under our third strategic direction, which is to improve postsecondary success. For an explanation of why FAFSA completion rates are so important to track and how FAFSA completion is connected with both college enrollment and persistence, see our post from April of this year about the significant decline in FAFSA completion rates this year. Both postsecondary enrollment and persistence are part of our strategic goal for Credentials, Certificates, Diplomas, and Degrees: Improve postsecondary enrollment success to 65%.
The Postsecondary Enrollments section of our regional profile (outlined in gold in the earlier image) identifies some notable disparities in the Land of Sky region. Gaps are clearly shown in postsecondary enrollments for groups based on income level (low-income students has much lower enrollment rates than students who are not low-income) and race and ethnicity (Hispanic students have the lowest enrollment rates, while white students have the highest).
Deep Dive into FAFSA Data
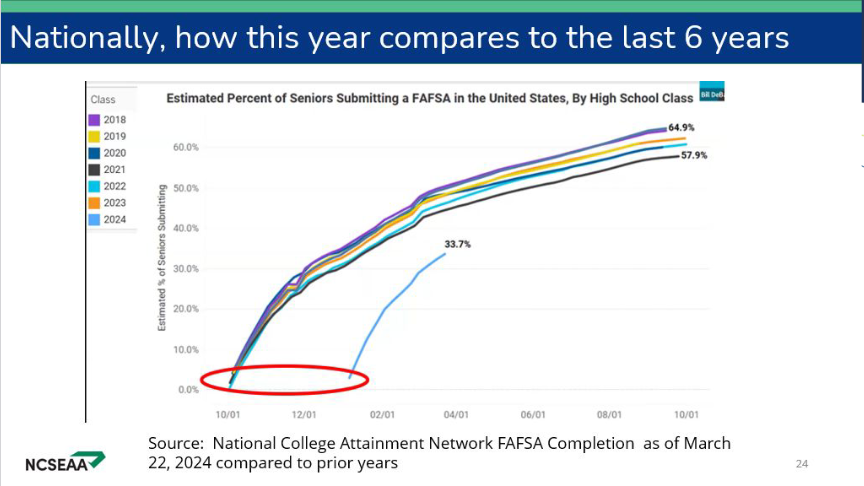
Kathy Hastings from the North Carolina State Education Assistance Authority led the deep dive section to further explain the featured data points in this webinar. She shared the troubling news that FAFSA completions are drastically lower nationwide compared to the last six years (see below). Her explanation about the connections between FAFSA completions and postsecondary enrollment was similar to what we shared in our post on the decline in FAFSA completions. She also talked about two FAFSA-related tools on CFNC’s website: the NC FAFSA Tracker, which provides data on FAFSA submissions and completions that can be filtered by school, school district, county, and other characteristics; and a finish-the-FAFSA tool that is part of CFNC’s Professional Tools (ProTools) suite and that school counselors can use to identify individual students within their school who might need additional assistance to complete the FAFSA.
Best Practices To Increase FAFSA Completions
The best practices section of this webinar featured Irma Bannerman, a school counselor from Duplin County Schools, who talked about some of the strategies and tactics that Duplin County Schools have successfully implemented to reduce barriers and increase FAFSA completions. The list included outreach ranging from one-on-one with students and families to full classrooms to school-wide advertising campaigns, providing time in class to fill out the FAFSA form and for advisors to answer students’ questions, and holding daytime information sessions in the library and cafeteria.
Land of Sky P20 Council's Efforts To Increase FAFSA Completions
From our earliest days, we have focused some of our initiatives at the Land of Sky P20 Council on increasing FAFSA completions in our region. Some of these efforts include P20 staff assisting with FAFSA Day, working with partners to host a FAFSA sweepstakes, and creating our FAFSA PACK that our partners can borrow and use for FAFSA outreach. We conducted FAFSA outreach at the recent Construction Career Days event and at the WNC Career Expo, and we regularly post updates on FAFSA submissions and completions in the Land of Sky region. FAFSA completions are so important to our work that we even had an entire action team focused on increasing FAFSA completions: the Pathways to Enrollment through FAFSA action team. We also help connect students and families with FAFSA resources.
Visit myFutureNC’s FAFSA Completion Rate indicator page for more information including a definition of FAFSA Completion Rate, an explanation for why this indicator matters, data on the state’s performance, details on the methodology, and links to other organizations in NC that are working on this topic.
Stay tuned for more in this series. Next up: NC Pre-K.
